Marketing
Calculating...
Jun 2026
SaaS Benchmarks in 2026: Key Metrics and Industry Standards
In our in-depth guide, discover how you can identify and measure the SaaS benchmarks you need to get valuable insights for your business decision-making.

Your SaaS business may be growing across metrics such as customer acquisition cost, retention rate, lifetime value or conversion rate.
But could you be growing faster?
That's the beauty of SaaS benchmarking. But with wide varieties of business models, pricing, cost strategies and revenue drivers, the process isn’t as easy as you might think.
As a SaaS SEO agency that’s worked with 50+ SaaS brands and delivered an average of +187% organic leads in 6 months, we know the metrics that matter inside out.
In this guide, we'll help you understand customer retention, lifetime value, and acquisition cost, so you can compare your performance with industry standards.
What We'll Cover:
What is Benchmarking in SaaS?
Benchmarking in SaaS is the process of tracking a company's performance against industry standards (i.e., benchmarks) and competitors.
In its simplest terms, benchmarking works like this. First, a SaaS company identifies the key performance indicators (KPIs) it wants to measure. Then, it compares them to industry standards and competitors before analyzing the gaps.
SaaS companies use these metrics to:
- Gauge their effectiveness and position in the market
- Understand the effectiveness and the position of their competitors (and what they can learn/steal/implement)
- Pinpoint areas for improvement and optimization in their marketing, sales and conversion processes
How Do You Select the Right Benchmarks?
An important caveat: Tracking every metric ever created is a losing battle and will likely have your head spinning and leave you no clearer about your performance.
So, what's the key to selecting the right benchmarks? It's all about understanding the unique needs of your business and whether the benchmark will help optimize your performance.
Here are four factors that will help you make the correct decision.
1. Business Objectives and Strategy
Your benchmarks should reflect two things:
- Your specific business objectives
- The strategic priorities of your SaaS company
This ensures that performance measurements are relevant to the intended outcomes. In other words, it allows for a more accurate assessment of SaaS effectiveness because you’re working with benchmarks that impact key performance indicators tied to their core strategies.
Prioritize metrics that contribute to your business's unique value proposition, competitiveness, and long-term success. This way, you measure technical performance and gather actionable insights for improving business outcomes and driving strategic success.
2. Company Size and Stage
Company size and stage are crucial. Smaller companies might prioritize cost-effectiveness and niche audiences. Larger enterprises may focus on global expansion and multi-pronged campaigns.
Whether you're a startup, a mid-sized firm, or an established corporation, your company's development stage influences its technology requirements and growth trajectory.
Benchmarks need to align with these factors to provide meaningful insights. If you aren’t tailoring SaaS benchmarks to your company size and stage, you are likely matching up against unrealistic, irrelevant, or unreflective metrics.
3. Data Availability and Accuracy
If you don't have accurate data, you can't benchmark performance effectively. Benchmarking relies on reliable metrics, and incomplete or inconsistent data can lead to misleading conclusions and poor decision-making.
Access to comprehensive, up-to-date data gives SaaS companies a clearer picture of performance across key areas such as revenue, customer acquisition, retention, and profitability. It also makes it easier to identify trends, compare results against benchmarks, and measure progress over time.
By prioritizing data quality and availability, businesses can trust the insights generated from their benchmarking efforts and make more informed decisions about growth, efficiency, and long-term performance.
4. Competitor Analysis
Competitor analysis is essential for gaining a competitive edge and understanding market positioning. When done well, understanding what your competitors are achieving helps you:
- Identify relative strengths and weaknesses. This comparison enables informed decision-making and strategic planning
- Get insight into industry best practices and customer expectations
- Set realistic performance goals and differentiate yourself by addressing gaps or surpassing industry standards.
Armed with this data, you can take a proactive approach to market changes and adapt your product or service to stay ahead.
The Essential SaaS Benchmarking Metrics to Track
Benchmarking metrics can drive strategic decision-making and business success. It also helps you gauge customer engagement, revenue streams, and company health. But which metrics should you choose?
Your list will depend on two things:
- The kind of performance you want to analyze
- How you are planning to optimize your present product, service, or way of working
Here’s a list of eight essential SaaS metrics every SaaS company should follow.
#1 Monthly Recurring Revenue (MRR)
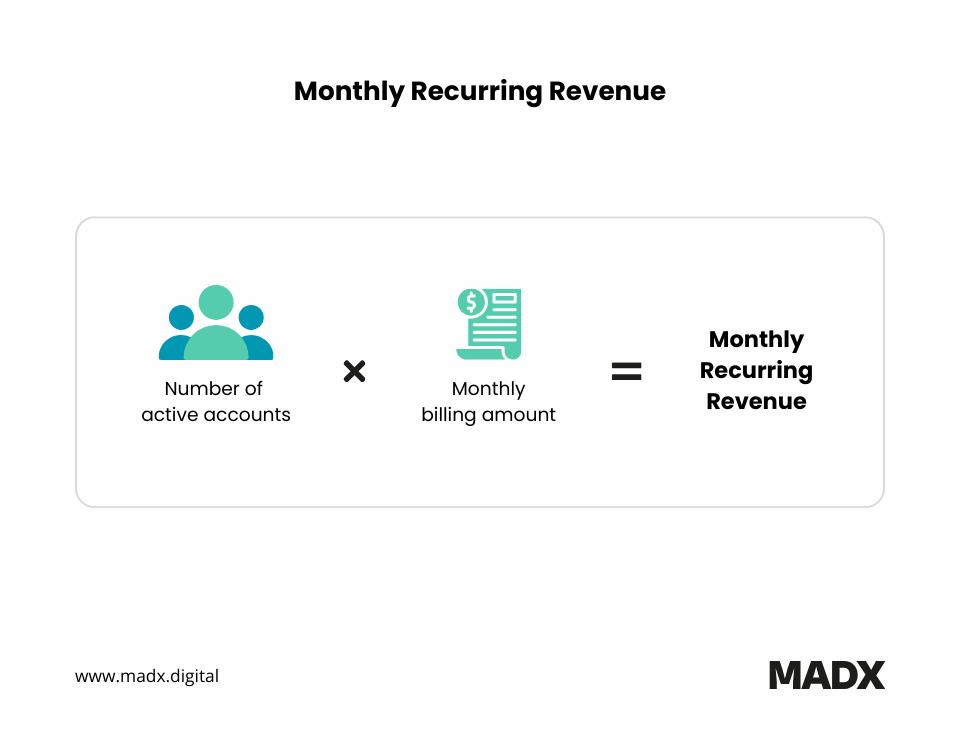
MRR is a key benchmarking metric. It represents the predictable, recurring income generated by subscription-based services on a monthly basis. You calculate MRR by adding up the monthly subscription fees from active customers.
This metric gives SaaS companies a reliable indicator of their ongoing financial performance. It helps forecast revenue streams, check customer retention, and assess the health of a SaaS business.
This metric is crucial for decision-making, allowing companies to make informed choices about scaling operations, adjusting pricing strategies, optimizing customer acquisition efforts, and giving insights into the sustainability of their business model.
#2 Customer Acquisition Cost (CAC)
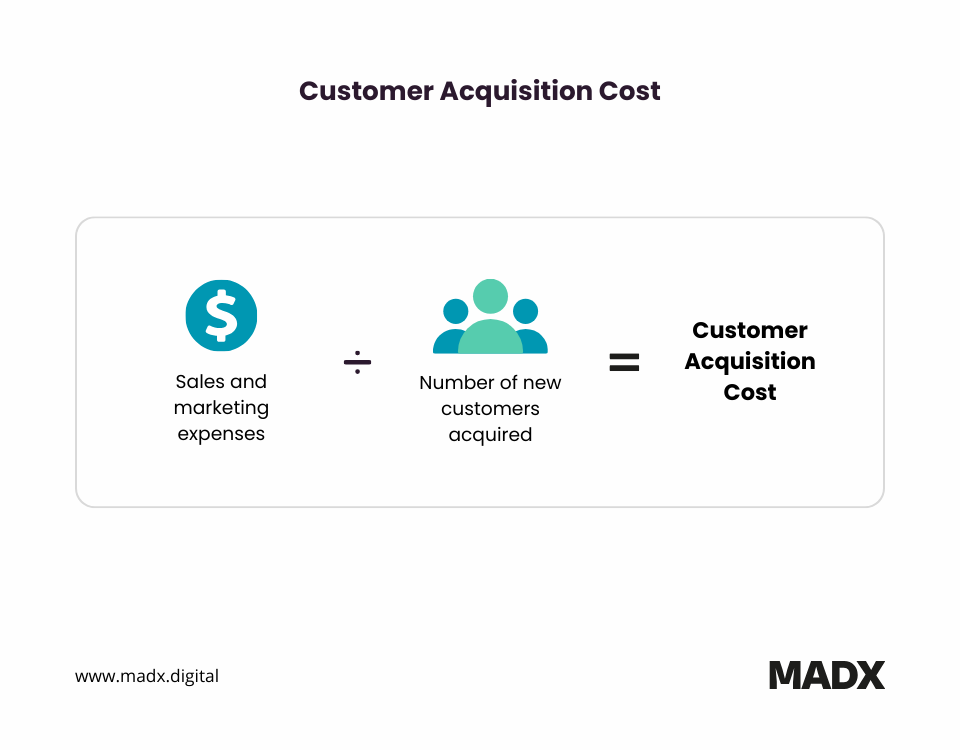
CAC represents the total expenses incurred to acquire a new customer. You calculate CAC by dividing the total sales and marketing costs by the number of new customers acquired within a specific period.
CAC is essential for evaluating the efficiency and sustainability of customer acquisition efforts. The lower your sales and marketing expenses per new customer, the more return you can generate when you onboard a new customer or client.
By comparing this benchmark against your previous performance or competitors, you can understand;
- Whether you need to optimize your sales and marketing efforts,
- If you need to allocate resources better
- Whether you can improve operational efficiency
It’s obvious that most SaaS companies would aim to lower their CAC. But how? Here are a few strategies that can help you achieve this.
- Optimize your website: Improve conversion rates by making it easier for visitors to find information, sign up, and become customers.
- Prioritize your leads: Focus sales and marketing efforts on prospects most likely to convert and deliver long-term value.
- Target your ideal customers: Refine your audience to attract those best suited to your product and pricing model.
- Test and experiment with ad campaigns: Continuously evaluate messaging, targeting, and channels to improve acquisition efficiency.
- Create engaging content: Publish content that educates prospects, builds trust, and supports customer acquisition across the buying journey.
- Improve your sales funnel: Identify and remove friction points that prevent prospects from progressing toward conversion.
- Implement marketing automation: Automate repetitive tasks and nurture campaigns to improve efficiency and reduce acquisition costs.
- Use referral programs: Encourage existing customers to recommend your product and generate lower-cost customer acquisition.
#3 CAC Payback Period
CAC Payback Period measures how long it takes for a SaaS company to recover the cost of acquiring a new customer. You calculate it by dividing Customer Acquisition Cost (CAC) by the monthly gross profit generated by that customer.
This metric helps SaaS businesses evaluate the efficiency of their sales and marketing investments. A shorter payback period means acquisition costs are recovered faster, allowing the company to reinvest capital into growth more quickly.
Monitoring the CAC Payback Period can help identify issues with pricing, customer acquisition efficiency, or customer value.
If the payback period is increasing, businesses may need to improve conversion rates, reduce acquisition costs, increase average contract values, or strengthen customer retention strategies.
#4 Churn Rate
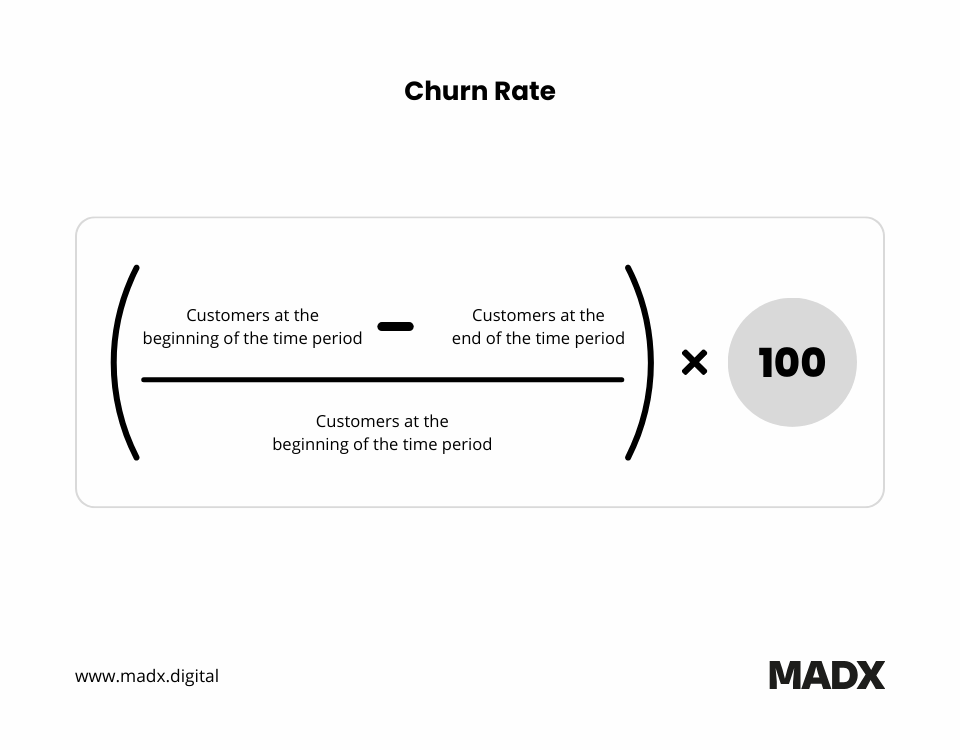
Churn Rate measures the percentage of customers who cancel or stop using a service within a specific time period. You calculate the churn rate by dividing the number of lost customers by the total number of customers at the beginning of the period.
This rate reflects customer retention and the health of a SaaS business. High churn rates signal issues with your SaaS product, customer support, or competitive pressures. Monitoring and reducing churn is crucial for sustaining revenue growth, as acquiring new customers costs more than retaining existing ones.
Are you seeing higher churn rates than the industry average or your previous number? Here are some strategies we recommend implementing, depending on the cause:
- Enhance product features or solve present issues
- Optimize your customer support experience
- Differentiate your product from the competition
- Revamp your pricing strategy
#5 Customer Retention Rate
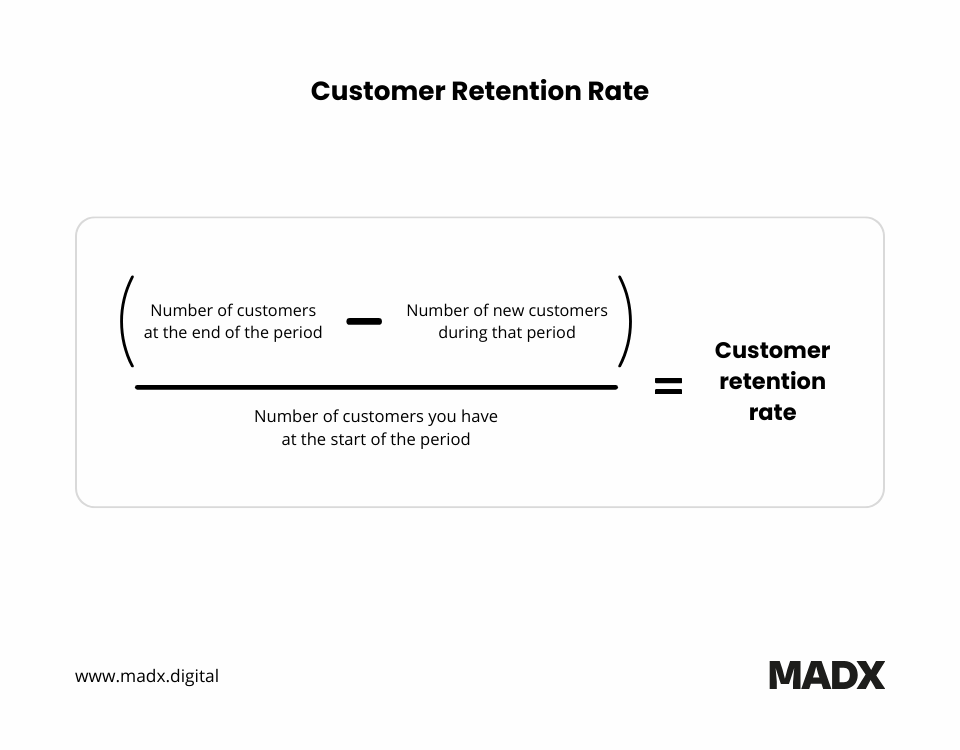
Customer retention rate measures the percentage of customers retained over a specific period. You calculate this by subtracting the number of customers you have at the end of a specific period from the starting number, then dividing the difference by the starting number.
It helps you gauge customer loyalty, customer satisfaction, and the effectiveness of a SaaS business in retaining its user base. A high retention rate is crucial for sustainable growth. It signifies that customers like associating with your business, reducing the need for constant customer acquisition.
A strong retention rate contributes to long-term customer relationships, increased customer lifetime value, and greater future predictability. Here are some strategies you can use to increase your retention rate.
- Provide excellent customer service: Offer prompt and helpful support to enhance customer satisfaction.
- Personalize the customer experience: Tailor interactions based on customer preferences to create a more valuable experience.
- Implement a loyalty program: Introduce rewards for repeat business and encourage long-term loyalty.
- Regularly communicate with customers: Stay connected through newsletters, emails, and other relevant updates.
- Seek and act on customer feedback: Use customer feedback to improve products, services, and the overall experience.
- Offer special promotions and discounts: Provide exclusive offers to reward loyalty and encourage repeat purchases.
- Create a seamless omnichannel experience: Deliver a consistent experience across all customer touchpoints and channels.
- Anticipate customer needs: Proactively address customer concerns and requirements before they become issues.
#6 Net Revenue Retention (NRR)
Net Revenue Retention (NRR) measures the percentage of recurring revenue retained from existing customers over a specific period, including upgrades, expansions, downgrades, and churn.
You calculate NRR by dividing the ending recurring revenue from an existing customer cohort by the starting recurring revenue from that same cohort and multiplying by 100.
NRR is one of the most important SaaS benchmarking metrics because it shows whether a company can grow revenue from its existing customer base. A score above 100% indicates that expansion revenue is outpacing revenue lost through churn and downgrades.
This metric is particularly valuable for subscription businesses because it highlights customer satisfaction, product adoption, and account growth. A strong NRR can support sustainable revenue growth even if new customer acquisition slows.
Companies looking to improve NRR should focus on customer success, product adoption, upselling opportunities, and reducing customer churn.
#7 Customer Lifetime Value (CLTV)
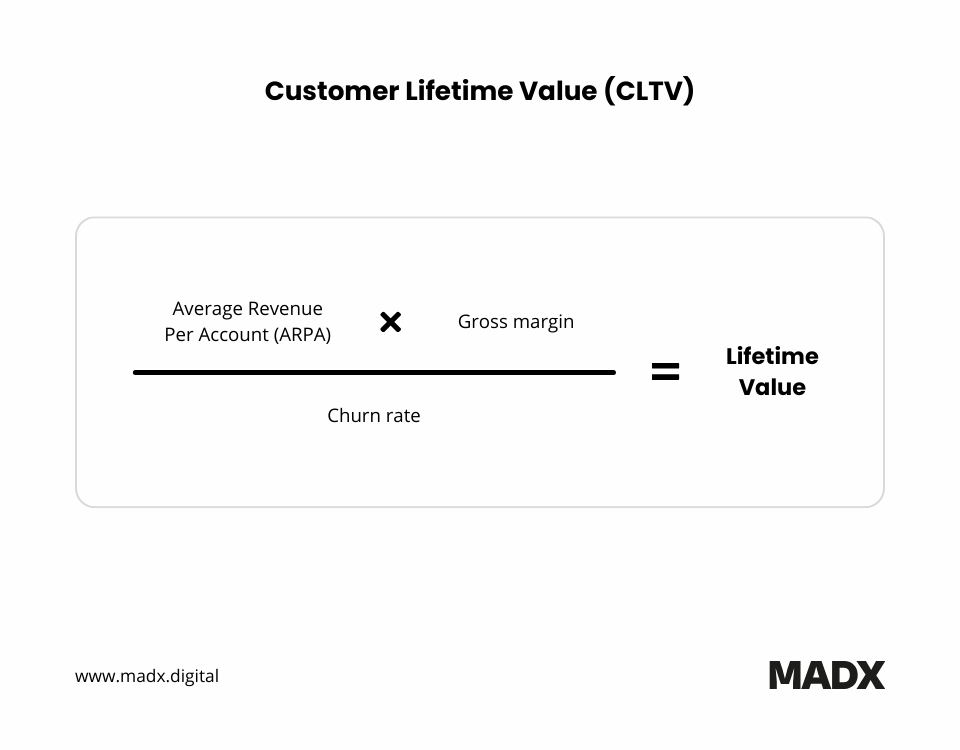
CLTV is the total revenue a business expects to generate from a customer throughout their entire relationship. To calculate it, multiply the average revenue per user by the average customer lifespan.
CLTV is essential for assessing the long-term profitability and sustainability of customer relationships. SaaS companies want to maximize this metric. You want the revenue generated from a customer to exceed the CAC and ongoing service delivery.
Monitoring CLTV helps businesses make strategic decisions about pricing, customer retention, and marketing investments. If your CLTV value is low, aim for service expansions, customer engagement, and focused strategies to upsell and cross-sell to your existing customers.
#8 Average Revenue Per User (ARPU)
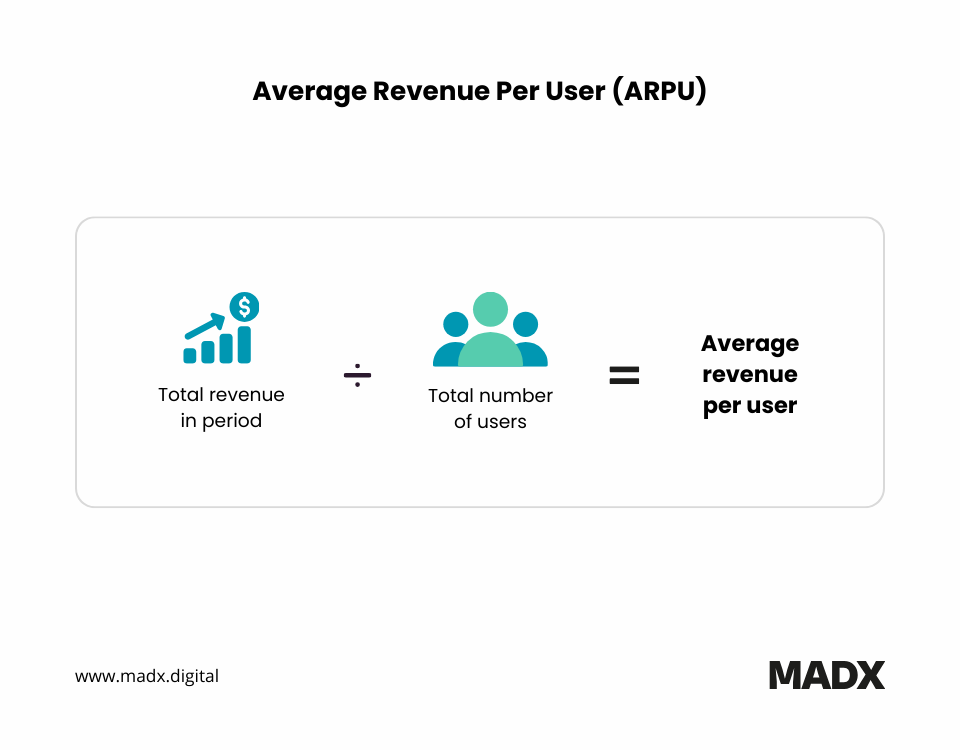
ARPU denotes the average monthly or annual revenue generated per customer. You can calculate this by dividing the total revenue by the number of active users within a specified period.
It helps you monitor the financial health and performance of a SaaS business. Because this metric varies by growth stage, niche, pricing model, and the geography you’re targeting, avoid comparing it to other businesses.
If you see a declining number, it may point not only to churn but also to the churn of your highest-spending clients. You can optimize your ARPU by:
- Increasing customer spending through upsells and cross-sells
- Introducing higher-tier subscription plans
- Focusing on customer retention
- Training your team to implement account expansion strategies
#9 Gross Margin
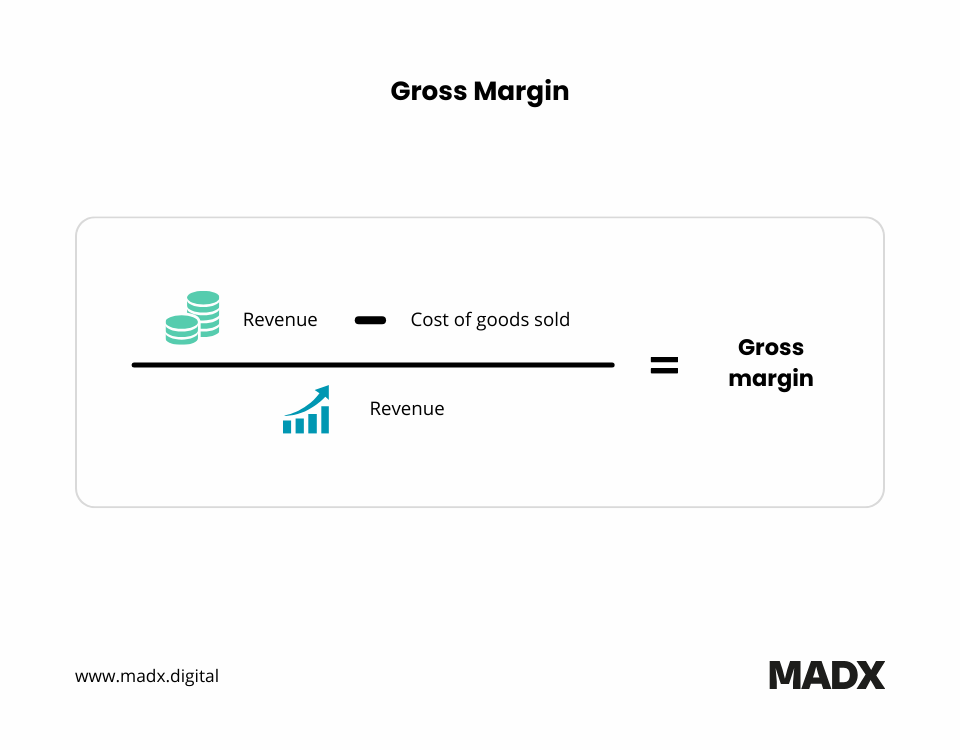
Gross margin is a SaaS benchmarking metric that measures the profitability of a SaaS company’s core operations. You can calculate it by subtracting the cost of goods sold (COGS) from total revenue, then expressing the result as a percentage.
It reflects the proportion of revenue retained after accounting for direct production costs. For SaaS, COGS includes expenses related to hosting, infrastructure, and customer support. A high gross margin shows your efficiency and scalability in delivering services.
By comparing this metric to your past numbers or other companies in the industry, you can get an idea of where you stand in your market. It shows you the financial viability and sustainability of a SaaS business.
#10 Net Promoter Score (NPS)
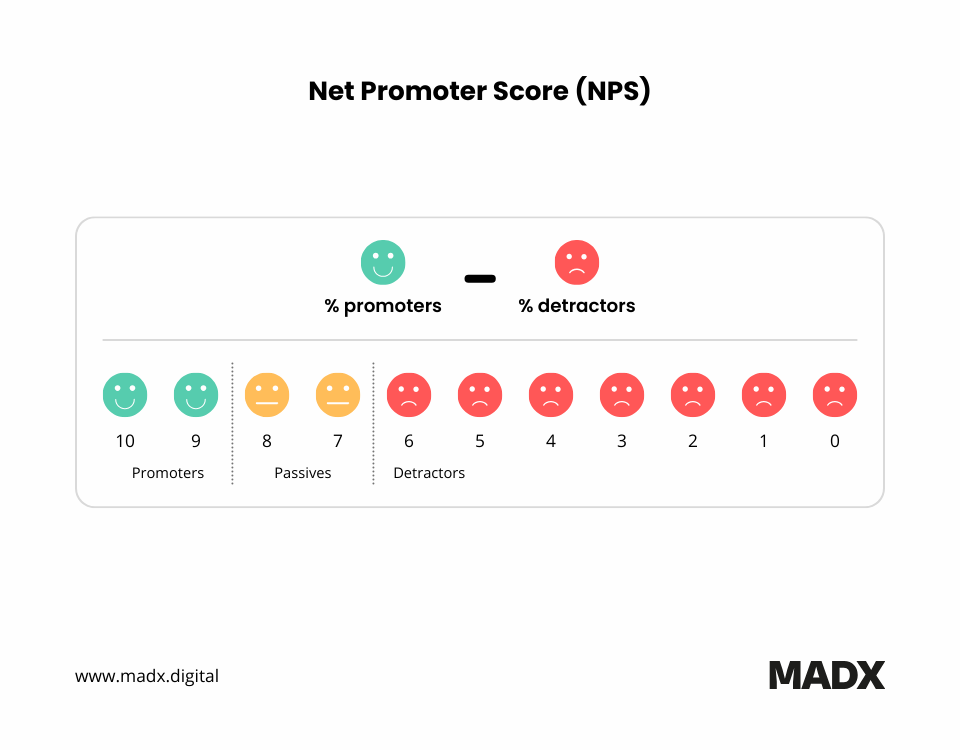
NPS is a key customer satisfaction metric for SaaS businesses. It gauges the likelihood that customers will recommend a product or service to others. Based on a simple survey question asking customers to rate their likelihood of recommending the product on a scale of 0 to 10, NPS categorizes respondents into promoters, passives, and detractors.
You can calculate your NPS score by subtracting the percentage of detractors from the percentage of promoters. A positive NPS indicates a higher likelihood of customer advocacy and satisfaction.
SaaS companies use NPS to measure customer loyalty, identify areas for improvement, and refine their products and services based on customer feedback. A strong NPS contributes to customer retention, brand reputation, and business success.
#11 Magic Number
The Magic Number measures how efficiently a SaaS company generates new recurring revenue from its sales and marketing investments. It is calculated by comparing quarter-over-quarter growth in recurring revenue against sales and marketing spend from the previous quarter.
This benchmark helps companies assess whether their go-to-market strategy is generating sufficient returns. A higher Magic Number suggests that sales and marketing investments are producing strong revenue growth, while a lower figure may indicate inefficiencies in customer acquisition or revenue generation.
Tracking the Magic Number helps SaaS leaders evaluate growth efficiency and make informed decisions about hiring, budget allocation, and expansion plans.
If performance is below expectations, businesses may need to improve sales productivity, refine their targeting strategy, or increase conversion rates throughout the customer journey.
#12 Burn Multiple
Burn Multiple measures how efficiently a SaaS company converts cash burn into new recurring revenue growth. You calculate it by dividing net cash burned over a specific period by the amount of net new Annual Recurring Revenue (ARR) generated during that same period.
This metric has become an important benchmark for evaluating capital efficiency, particularly among venture-backed SaaS companies. A lower Burn Multiple indicates that the business is generating revenue growth with less capital, while a higher figure may signal inefficient spending.
Monitoring Burn Multiple helps leadership teams assess the sustainability of growth strategies and identify opportunities to improve operational efficiency. If the metric begins to rise, companies may need to review hiring plans, sales and marketing investments, or overall spending levels to improve capital allocation.
#13 Rule of 40
The Rule of 40 is a SaaS performance benchmark that combines revenue growth and profitability into a single metric. You calculate it by adding a company's annual revenue growth rate to its profit margin.
The benchmark is based on the principle that healthy SaaS companies should balance growth and profitability. A combined score of 40% or more is generally considered a strong indicator of sustainable performance.
Investors and executives use the Rule of 40 to assess whether a company is growing efficiently. It provides a more balanced view than revenue growth or profitability alone, helping businesses understand whether they are generating long-term value while maintaining financial discipline.
Get to Know Your Metrics
The best SaaS companies don’t rely on blind luck and gut feeling. They meticulously track every important metric and use the data to refine their business strategies.
Monitoring vital SaaS benchmarks is crucial for business success. At the very minimum, you should be
- Focusing on customer satisfaction by tracking acquisition cost (CAC), lifetime value (CLV), and churn rate.
- Keep an eye on finances with metrics like annual recurring revenue and gross/net revenue.
- Ensuring smooth operations and quick support.
- Growing with active users and virality coefficient.
- Striking a balance between expansion and retention.
If you need help improving your marketing metrics, reach out to our team at MADX.
Frequently Asked Questions
What are SaaS benchmarks?
SaaS benchmarks are performance metrics used to evaluate the health, growth, and efficiency of a software-as-a-service business. They help companies compare performance against industry standards, competitors, and historical results to identify strengths and improvement opportunities.
Which SaaS metrics should every company track?
Most SaaS companies track a combination of revenue, retention, profitability, and growth metrics. Common examples include MRR, CAC, churn rate, CLTV, NRR, gross margin, and customer retention rate.
How often should SaaS benchmarks be reviewed?
The review frequency depends on the metric being measured. Revenue, acquisition, and retention metrics are commonly monitored monthly, while broader efficiency and financial performance metrics may be reviewed quarterly.
Why is benchmarking important for SaaS companies?
Benchmarking helps businesses understand how they are performing over time and where improvements are needed. It can highlight opportunities to improve customer retention, increase revenue, strengthen profitability, and allocate resources more effectively.
How do SaaS companies use benchmarks to measure performance?
SaaS companies use benchmarks to track progress against internal goals, evaluate trends, compare performance with peers, and support strategic decision-making. Benchmarking provides a framework for assessing business health across revenue growth, customer acquisition, retention, and operational efficiency.
.png)
Latest articles
What we've published in the past 30 days — across SEO, GEO, content, and digital PR.