Marketing
Calculating...
May 2026
SaaS Marketing Metrics - Track Only the KPIs that Matter
Understand key SaaS marketing metrics that help teams measure performance, optimize spend, improve ROI, and forecast predictable, scalable revenue growth.

Every SaaS marketing team faces the same problem. Your dashboard is drowning in metrics.
Lead volume, conversion rates, NPS scores, engagement metrics, monthly recurring revenue, and customer lifetime value. The list never ends. You're tracking everything but understanding nothing.
See, when every number feels important, nothing actually is. You end up paralyzed, unable to separate signal from noise.
As a B2B SaaS SEO agency, we've worked with dozens of SaaS companies struggling with this exact problem. In this blog, we'll show you which SaaS marketing metrics drive real decisions and which ones are just vanity numbers in disguise.
Let’s get started.
What We'll Cover
TL;DR - SaaS Marketing Metrics
Short on time? Can’t read the whole article? No worries.
Just focus on these core metrics that directly tie to your revenue and growth:
- Customer Acquisition Cost (CAC): What you spend to acquire each customer.
- Lifetime Value (LTV): How much revenue each customer generates over time.
- LTV:CAC Ratio: Your profitability scorecard (aim for 3:1 or better).
- Net Revenue Retention (NRR): Revenue kept from existing customers, including expansions.
- CAC Payback Period: How long until you recover acquisition costs.
- Churn Rate: Percentage of customers you're losing each month.
- Free-to-Paid Conversion Rate: How many free trial or freemium users become paying customers.
- Magic Number: Sales efficiency per dollar of marketing spend.
So which SaaS marketing metrics actually matter? The honest answer is: it depends. It depends on your growth stage, your business model, what your team controls, and how far into the customer journey your marketing reaches.
An early-stage startup needs different metrics than a company raising Series B. We’ll talk about these in more detail in the next sections.
Why Do Most SaaS Companies Track the Wrong Marketing Metrics?
The problem comes down to one word: attribution.
SaaS marketing is incredibly complex. Before someone even becomes a marketing-qualified lead, they've had around 54 touchpoints with your brand after their first website visit.
By the time they actually subscribe and become a loyal customer, you're looking at hundreds of interactions with your marketing content, sales team, customer support, and product.
This creates a massive challenge. Most deals happen because of joint efforts across your entire organization:
- Marketing nurtures the lead.
- Sales close them.
- Customer success keeps them happy.
- Product delivers value.
Everyone plays a part.
So, which metrics belong to marketing?
This is where teams get stuck. You can't judge marketing performance by customer lifetime value or churn rate alone.
Yes, these metrics matter. But they're influenced by every department, not just marketing.
You need a different approach.
Track metrics that span the entire funnel, from top-level indicators like website traffic to bottom-level metrics like monthly recurring revenue.
Financial metrics show you there's a problem. Marketing-specific metrics help you find the root cause.
Think of it this way. If revenue is down, that's a company problem. If your conversion rate from MQL to SQL dropped 40%, that's a marketing problem you can actually fix.
The key is separating what marketing controls from what marketing influences. Track both, but don't confuse the two.

How to Align SaaS Marketing Metrics With Business Goals
Your B2B SaaS metrics should tell a story about your business.
Here's how to build a measurement system that actually helps you make decisions:
- Pick Your North Star Metric: This is the one number that captures the core value you deliver to customers. For example, Slack chose "messages sent within an organization" because it directly ties to how teams collaborate and find value in the product. When your North Star goes up, everything else follows.
- Pair Leading and Lagging Indicators: Leading indicators predict what's coming. Website traffic forecasts future leads. Trial signups predict revenue. Lagging indicators show what already happened. Revenue reflects past marketing effectiveness. Churn shows past customer experience. You need both.
- Match Metrics to Your Stage: Early-stage companies need to prove people want the product. Growth-stage companies must prove they can acquire customers profitably. And scale-stage companies need to grow efficiently. Watch the Rule of 40 and retention rates. Different stages, different priorities. More on this later.
- Connect Metrics to Actions: Every metric should answer a specific question. Is our marketing working? Track SaaS conversion rates by channel. Are we acquiring customers profitably? Check LTV:CAC ratio. Are customers happy? Monitor NRR and churn. If a metric doesn't answer a question or drive a decision, drop it.
At MADX Digital, we build SEO strategies around the metrics that actually matter to your business.
Whether you're validating product-market fit or scaling to profitability, we align every piece of content, every backlink, and every technical improvement to move your specific North Star metric.
Let's map out how SEO can impact your growth goals.
We're confident enough in our approach that if your website isn't ranking in Google's top five positions for your three chosen keywords within 90 days, we refund your project fee.
Most Essential SaaS Marketing Metrics
These are the B2B SaaS KPIs that actually matter. Let's break down each one:
Customer Acquisition Cost (CAC)
This tells you how much you spend to acquire one customer. Add up all your marketing and sales expenses, then divide by ‘new customers acquired’.
SaaS CAC varies wildly based on your pricing and business model.
Say your SaaS charges $199/month. An $87 CAC makes perfect sense for your business. But that same number would be terrible for a $20/month product and amazing for a $500/month enterprise tool.
So don't get hung up on this benchmark. Focus on whether your unit economics actually work for your specific business.
Lifetime Value to CAC Ratio (LTV:CAC)
This compares how much a customer is worth to what you paid to acquire them.
It's your profitability scorecard.
- Below 1:1: You lose money on every customer.
- 2:1: Not sustainable.
- 3:1: Industry standard (aim here).
- 4:1: Great business model.
- Above 5:1: Excellent, but you might be underinvesting.
Make sure your customer lifetime value is at least three times higher than your CAC.
.webp)
CAC Payback Period
How long until you recover your acquisition costs? Faster is better because you can reinvest that money.
Top companies recover costs in under 6-12 months. If yours is above 24 months, you have a serious problem.
Net Revenue Retention (NRR)
This shows you whether your existing customers are spending more or less with you over time. It includes upgrades, downgrades, and cancellations.
Here's how it works:
Start with $100,000 in revenue from existing customers at the beginning of the year. By year-end, some upgraded to bigger plans, some downgraded, and some left.
If you're left with $110,000 from that same group (without any new customers), your NRR is 110%.
According to High Alpha's SaaS Benchmarks Report, companies with high NRR (above 106%) grow nearly 3x faster than those with low NRR.
When your existing customers naturally expand their spending, you're not constantly fighting to replace lost revenue.
Churn Rate
How many customers are you losing?
B2B SaaS companies average 3-8% monthly churn. Enterprise SaaS does better at 0.5% to 1%.
If you're losing more than 5-10% of customers per month, fix your product or customer success before investing more in acquisition.
Free-to-Paid Conversion Rate
If you offer a free trial or freemium model, this tells you how many free users actually become paying customers.
The structure of your trial dramatically impacts conversion:
- Free trial (no credit card): 18% to 25% typically convert
- Free trial (credit card required): 49% to 60% convert
- Freemium model: Only 2.6% to 3% convert to paid
If your conversion rate falls below 25% for traditional free trials, your onboarding and activation experience needs work.
Fix that before spending more on acquisition.
Magic Number
It's a widely used term among SaaS companies and investors.
This tells you if your sales and marketing spending is paying off. It measures how much new revenue you generate for every dollar you spend on getting customers.
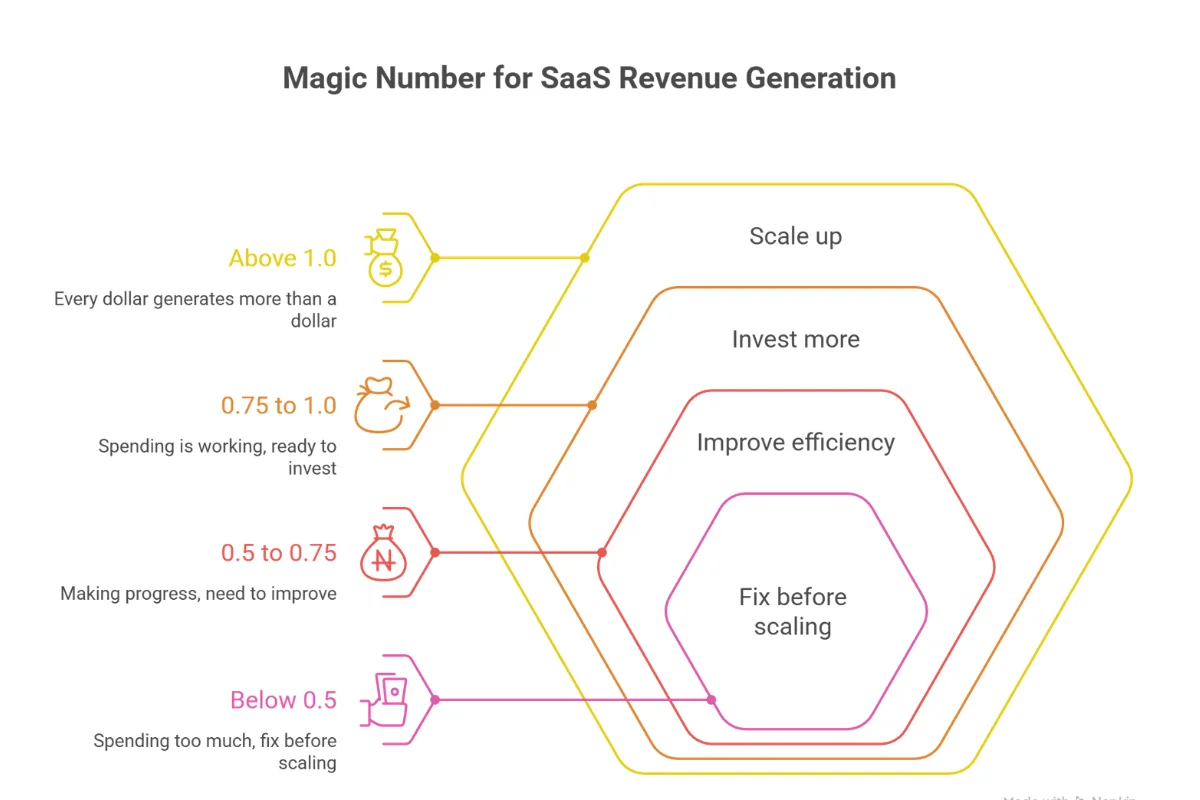
This is how it works:
If you spend $100,000 on sales and marketing this quarter and gain $80,000 in new annual recurring revenue, your Magic Number is 0.8.
- Below 0.5: You're spending too much to acquire too little revenue. Fix this before scaling.
- 0.5 to 0.75: You're making progress, but need to improve efficiency first.
- 0.75 to 1.0: Your spending is working. You're ready to invest more.
- Above 1.0: Every dollar you spend generates more than a dollar in annual revenue. Scale up.
The higher your Magic Number, the more efficiently you're turning marketing spend into revenue.
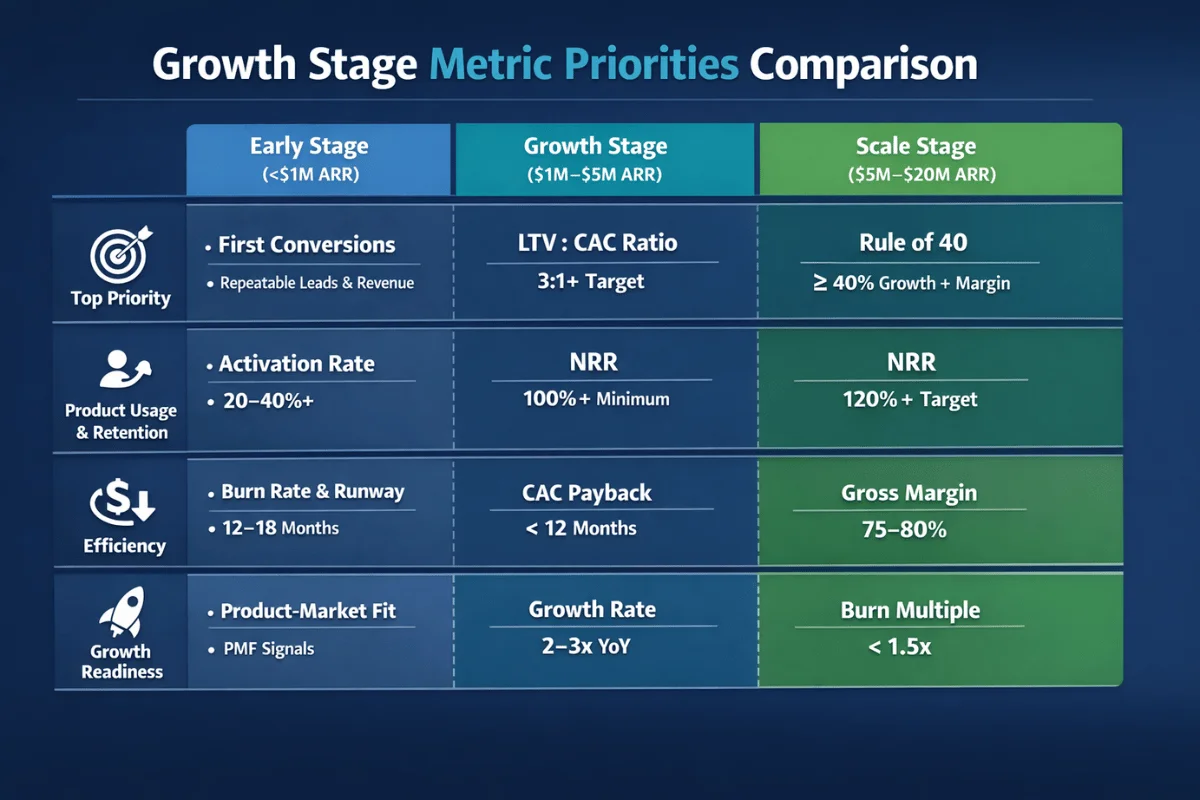
How to Prioritize Metrics Based on Your Growth Stage
Your company's stage determines which SaaS metrics matter most.
Here's what to focus on:
Early Stage (Under $1M ARR)
You're validating product-market fit.
Jason Lemkin from SaaStr says, "If you have 10 unaffiliated customers in SaaS, you have something."
Focus on:
- First Conversions: Are people actually buying?
- Activation Rate: Do users reach their "aha moment"?
- Burn Rate: How long until you run out of money?
Don't obsess over efficiency yet. Just prove people want what you're building.
Growth Stage ($1M to $5M ARR)
Now you're proving unit economics.
Investors want to see a repeatable, scalable business model.
Your targets:
- LTV:CAC Ratio: At least 3:1
- NRR: 100% minimum, 120% ideal
- CAC Payback: Under 12 months
- Growth Rate: 2x to 3x year-over-year
Scale Stage ($5M to $20M ARR)
You're optimizing for profitability.
The days of growth-at-all-costs are over.
Watch these closely:
- Rule of 40: Growth rate plus profit margin should equal or exceed 40%
- NRR: Push toward 120%
- Gross Margin: Target 75% to 80%
- Burn Multiple: Keep it under 1.5x
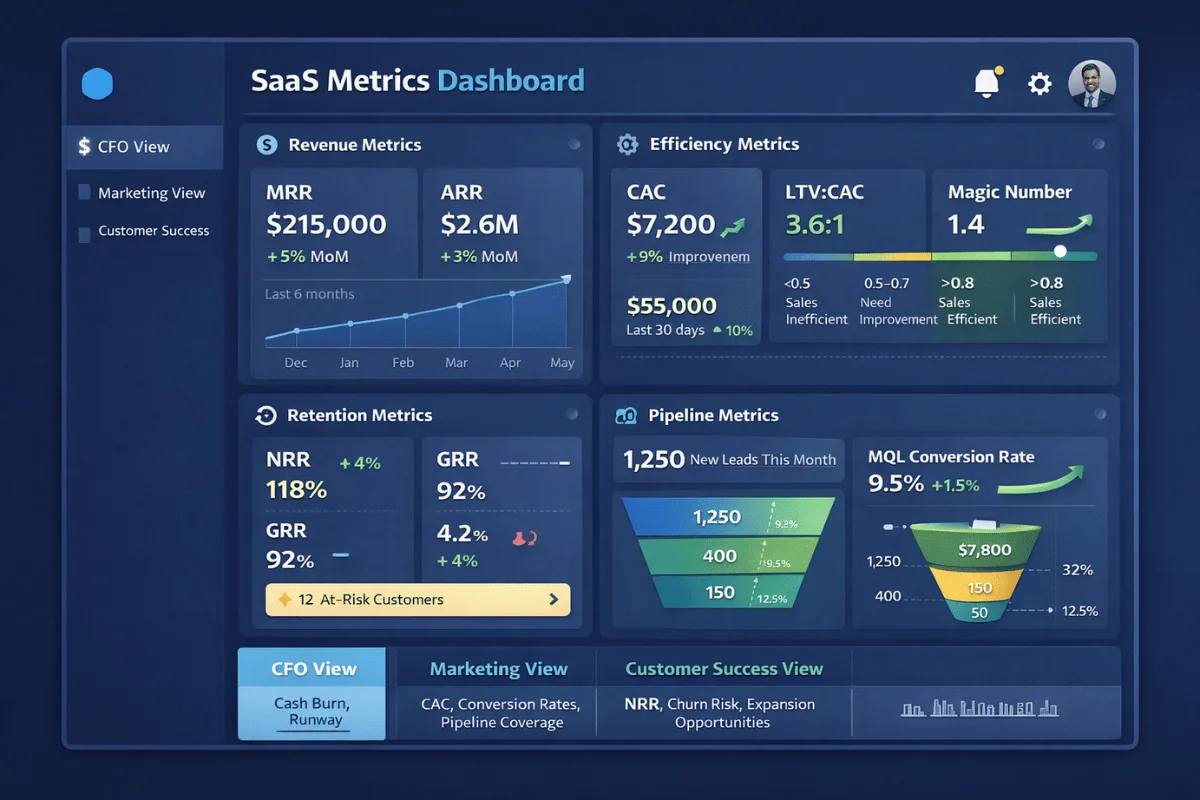
How to Build a SaaS Marketing Metrics Dashboard
A good SaaS KPI dashboard answers questions. A bad dashboard just displays numbers. Here's how to build the good kind.
First of all, include only actionable metrics.
Every number on your dashboard should drive a decision. If you can't act on it, remove it.
Your core dashboard needs:
- Revenue Metrics: MRR, ARR, Net New ARR.
- Efficiency Metrics: CAC, LTV:CAC, Magic Number.
- Retention Metrics: NRR, GRR, Churn Rate.
- Pipeline Metrics: Lead volume, conversion rates, sales velocity.
Then, make it role-specific.
Your CFO needs different data from your Customer Success Manager. Don't force everyone to use the same view.
- CFO View: Cash burn, runway, Rule of 40.
- Marketing View: CAC, conversion rates, pipeline coverage.
- Customer Success View: NRR, churn risk, expansion opportunities.
And most importantly, choose the right tool.
No. You don't need expensive software to start:
- No-Code Tools: Databox (around $199/month) or Geckoboard (around $75/month) for quick setup.
- Spreadsheets: Google Sheets or Excel work fine initially.
- SaaS-Specific: ChartMogul or ProfitWell for subscription analytics.
Start simple. You can always upgrade later.
How to Analyze SaaS Marketing Metrics for Better Decisions
Collecting data is easy. Turning it into insights is hard.
Here's how to analyze your metrics in ways that actually improve your business:
- Use Cohort Analysis: Group customers by signup date and track their behavior over time. Look for newer cohorts performing better (product improving), churn stabilizing after a few months (predictable revenue), or specific dropoff points like Day 14 (fix these first).
- Compare Leading and Lagging Indicators Together: Look at how metrics relate to each other. Traffic up, but conversions down means the wrong audience. Trial signups are flat, but activation is rising means focus on getting more trials.
- Watch for Attribution Problems: B2B SaaS deals are complex. The average deal requires 266 touchpoints and takes hundreds of days from first impression to customer. Plus, you're dealing with five to 11 decision-makers in the buying group, according to Gartner. Last-click attribution gives all credit to the final touchpoint, missing the full picture. Use multi-touch attribution instead.
- Segment Your Data: Average metrics hide important details. Break down numbers by customer size, industry, or acquisition channel. You might find enterprise customers have 95% retention while SMB customers churn at 15%. Now you know where to focus.
Common Measurement Mistakes to Avoid
Even experienced teams make these errors.
Here are the biggest mistakes to watch for and how to avoid them:
- Double-Counting Revenue: The same contract appears in both new business and expansion categories. You inflate your numbers without realizing it. Set clear rules: is it an upgrade, expansion, or new business? Pick one definition and stick to it.
- Using Inconsistent Definitions: You calculate NRR differently each month, making it impossible to compare performance over time. Document your formulas once. Make sure everyone uses the same calculations every time.
- Ignoring Context: A 5% monthly churn rate means different things for different businesses. Enterprise SaaS should be under 1%. SMB SaaS averages 3% to 5%. Consumer SaaS often exceeds 10%. Always benchmark against similar companies at similar stages.
- Overlooking Retention Metrics: Teams focus on acquisition while ignoring retention. But your best customers are the ones you already have. Net Dollar Retention matters as much as new customer acquisition. Track both sides of the equation.
- Tracking Metrics You Can't Act On: If a metric doubles tomorrow and you don't know what to do differently, stop tracking it. Every metric on your dashboard should drive a specific decision or action.

Let's Build Your Growth Strategy
Tracking metrics is one thing. Building a system that drives growth is another.
Most SaaS teams get stuck analyzing data instead of acting on it. The real win comes when your metrics directly inform strategy and everyone on your team knows exactly what moves the needle.
That's where we come in.
At MADX Digital, we've helped B2B SaaS companies turn organic search into a predictable growth channel.
We don't just optimize for traffic. We optimize for the metrics that matter to your business: demo calls, trial signups, and sustainable MRR growth. Our team has built SaaS products before, so we understand the full funnel from first click to paying customer.
If you're ready to build an SEO strategy that actually impacts your bottom line, let's talk. Schedule a free strategy session with our team.
Frequently Asked Questions (FAQs)
How Often Should SaaS Marketing Metrics Be Reviewed?
Match your review schedule to how fast things actually change. Traffic moves daily, so check it daily. Your pipeline shifts weekly, so review it weekly. Retention trends take a month to show patterns, so dig into those monthly.
Big-picture metrics like Rule of 40? You only need to look quarterly.
What SaaS Marketing Metrics Do Investors Expect?
Series A investors want 3:1 LTV:CAC, 100%+ NRR, and under 12-month payback.
Series B investors expect 110%+ NRR and progress toward Rule of 40. Requirements get stricter at each stage.
Are SaaS Marketing Metrics Different for PLG Companies?
Yes, PLG companies track Product Qualified Leads rather than Marketing Qualified Leads and focus heavily on activation rates and time-to-value.
They also measure viral coefficient to track word-of-mouth growth.

Latest articles
What we've published in the past 30 days — across SEO, GEO, content, and digital PR.


.png)